
In my last post, I used ARIMA model to carry out forecasting against a time series dataset. Although it worked, it is a bit too complicated and hard to understand for non expert users like me. Recently I came across Prophet which is an awesome library from Facebook for carrying out forecasting with time series data. After a bit of play with it, I reckon it is a much better alternative to classic techniques like ARIMA. Why? Here is what I quoted from Facebook Research Blog
We have frequently used Prophet as a replacement for the forecast package in many settings because of two main advantages:
Prophet makes it much more straightforward to create a reasonable, accurate forecast. The forecast package includes many different forecasting techniques (ARIMA, exponential smoothing, etc), each with their own strengths, weaknesses, and tuning parameters. We have found that choosing the wrong model or parameters can often yield poor results, and it is unlikely that even experienced analysts can choose the correct model and parameters efficiently given this array of choices.
Prophet forecasts are customizable in ways that are intuitive to non-experts. There are smoothing parameters for seasonality that allow you to adjust how closely to fit historical cycles, as well as smoothing parameters for trends that allow you to adjust how aggressively to follow historical trend changes. For growth curves, you can manually specify “capacities” or the upper limit of the growth curve, allowing you to inject your own prior information about how your forecast will grow (or decline). Finally, you can specify irregular holidays to model like the dates of the Super Bowl, Thanksgiving and Black Friday.
Prophet works with data that comes in different time intervals like daily, weekly, monthly and etc. It does not require a large amount of data like ARIMA requires for it to carry out forecasting. It also works with missing data from the time series dataset so it is more data tolerant and flexible.
More importantly to me who is not a stats expert, it is more intuitive and user friendly. It feels like using a decent point and shoot camera to take nice photos and not to worry about ISO, shutter speed and aperture settings because it is all figured out automatically and the result is quite good. So to produce a reasonable forecasting does not require too much effort and expertise. It is that simple.
Dataset
So lets put it in action with the classic sales dataset from Walmart, which is free to public. You can download the full dataset from here.
The files contain historical sales data for 45 Walmart stores located in different regions. Here are these files and what the data looks like in these files (first 5 rows),
- train.csv (date between 05/02/2010 and 26/10/2012)
| Store | Dept | Date | Weekly_Sales | IsHoliday |
| 1 | 1 | 5/2/10 | 24924.5 | FALSE |
| 1 | 1 | 12/2/10 | 46039.49 | TRUE |
| 1 | 1 | 19/2/10 | 41595.55 | FALSE |
| 1 | 1 | 26/2/10 | 19403.54 | FALSE |
- test.csv. We will use the holiday information for our forecast
| Store | Dept | Date | Weekly_Sales | IsHoliday |
| 1 | 1 | 5/2/10 | 24924.5 | FALSE |
| 1 | 1 | 12/2/10 | 46039.49 | TRUE |
| 1 | 1 | 19/2/10 | 41595.55 | FALSE |
| 1 | 1 | 26/2/10 | 19403.54 | FALSE |
For simplicity purposes, we only pick one store store #1 and department #1 and carry out forecasting with Prophet for the next year.
Process the data with Prophet
According to Prophet docs, we need to format our data to the format that Prophet can recognise. Since Prophet follows sklearn API interface, we can call model.fit and model.predict methods. This is how we train the model and carry out forecast/prediction. I think I can call it Machine Learning, just like many services that claim themselves having “Machine Learning” features:) Simply put, that is just statistics.
The dataset has to include 2 columns, ds and y,
- ds is the datetime type column which contains a list of datetime objects.
- y is simply the time based figures, the sales figure.
import pandas as pd
from fbprophet import Prophet
import matplotlib.pyplot as plt

# Read train.csv
train = pd.read_csv('train.csv')

# Convert the Date column to datetime type
train['Date'] = pd.to_datetime(train['Date'])

# Filtering out only store #1 and department #1 to a new dataframe
# with the required column names
store1_dept1_sales = train[(train['Store'] == 1) & (
    train['Dept'] == 1)][['Date', 'Weekly_Sales']]
store1_dept1_sales.columns = ['ds', 'y']
Fit the model and do the forecasting.
model = Prophet()
model.fit(store1_dept1_sales)
future = model.make_future_dataframe(periods=52, freq='W')
forecast = model.predict(future)
figure = model.plot(forecast)
plt.show()
forecast.to_csv('sales_forecast.csv')
Since that is weekly sales report, we use weekly as the frequency. Interestingly, Prophet can forecast daily sales using the weekly data set we fit in. So it is flexible.
That is it. At the end of the code, it renders this forecast chart and save the data into a csv file.  It looks pretty good to me considering how little effort on producing this forecast chart. This is what it contains (first 5 rows),
print(forecast[['ds', 'yhat', 'yhat_lower', 'yhat_upper']].tail(5))
| ds | yhat | yhat_lower | yhat_upper | |
|---|---|---|---|---|
| 190 | 2013-09-22 | 20443.488962 | 12518.858795 | 27468.180441 |
| 191 | 2013-09-29 | 20641.660038 | 12938.020617 | 27909.093330 |
| 192 | 2013-10-06 | 20477.833384 | 13299.782936 | 28176.877186 |
| 193 | 2013-10-13 | 22547.212544 | 15202.682886 | 29934.752752 |
| 194 | 2013-10-20 | 27710.351046 | 19897.129162 | 35997.097132 |
It has ds as the timestamp, yhat is the forecast value column which we care the most. There are also columns for components and uncertainty intervals, with these values, you can do more analysis. To my understanding, yhat_low and yhat_upper define the range for the forecast figure to indicate the uncertainty.
Factor in holiday information
The holiday dataframe needs 2 columns
- ds : the datetime column
- holiday: a string
# Build the holiday dataframe combining the current and future holiday information
train_store1_dep1_holiday = train[(train['Store'] == 1) & (
train['Dept'] == 1) & (train['IsHoliday'] == True)][['Date', 'IsHoliday']]
test = pd.read_csv('test.csv')
test_store1_dep1_holiday = test[(test['Store'] == 1) & (
test['Dept'] == 1) & (test['IsHoliday'] == True)][['Date', 'IsHoliday']]
combined_holiday = pd.concat(
[train_store1_dep1_holiday, test_store1_dep1_holiday])
combined_holiday['Date'] = pd.to_datetime(combined_holiday['Date'])
combined_holiday.columns = ['ds', 'holiday']
# Prophet requires the holiday column to be string so we need to convert the boolean
# to string
combined_holiday['holiday'] = combined_holiday['holiday'].map(
{True: 'Yes', False: 'No'})
# Pass in the holiday information
model = Prophet(holidays=combined_holiday)
model.fit(store1_dept1_sales)
future = model.make_future_dataframe(periods=52, freq='W')
forecast_holiday = model.predict(future)
figure = model.plot(forecast_holiday)
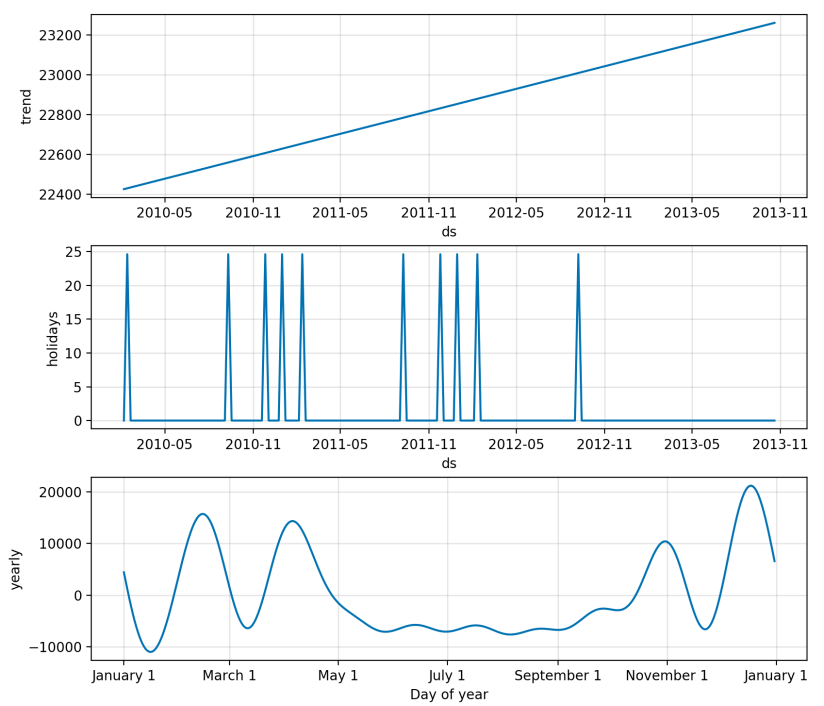
figure2 = model.plot_components(forecast_holiday)
So here is the chart,

It looks very similar to the previous chart but it did take the holiday into account as shown in the components plot.
So that is it.
Thoughts
I really like that Prophet allows you to produce a reasonably good forecast with so little effort. You do not need to be a stats expert to use it. You can of course tweak options if you know what you are doing, like tweaking the trend, seasonalities and holidays.
Comparing to ARIMA model which requires 4 to 5 whole seasons in the dataset, Prophet does not have this requirement so it is not data hungry. Having a large amount of historical data can be impossible to young companies.
The data files and the code can be found here.
Thanks.
